Post Images and Animated Job Posts in Your Brand
Charts, covers and eight-second job animations drawn from your own data in your colours and logo. AI chooses the layout and writes the words; every number comes from the data.
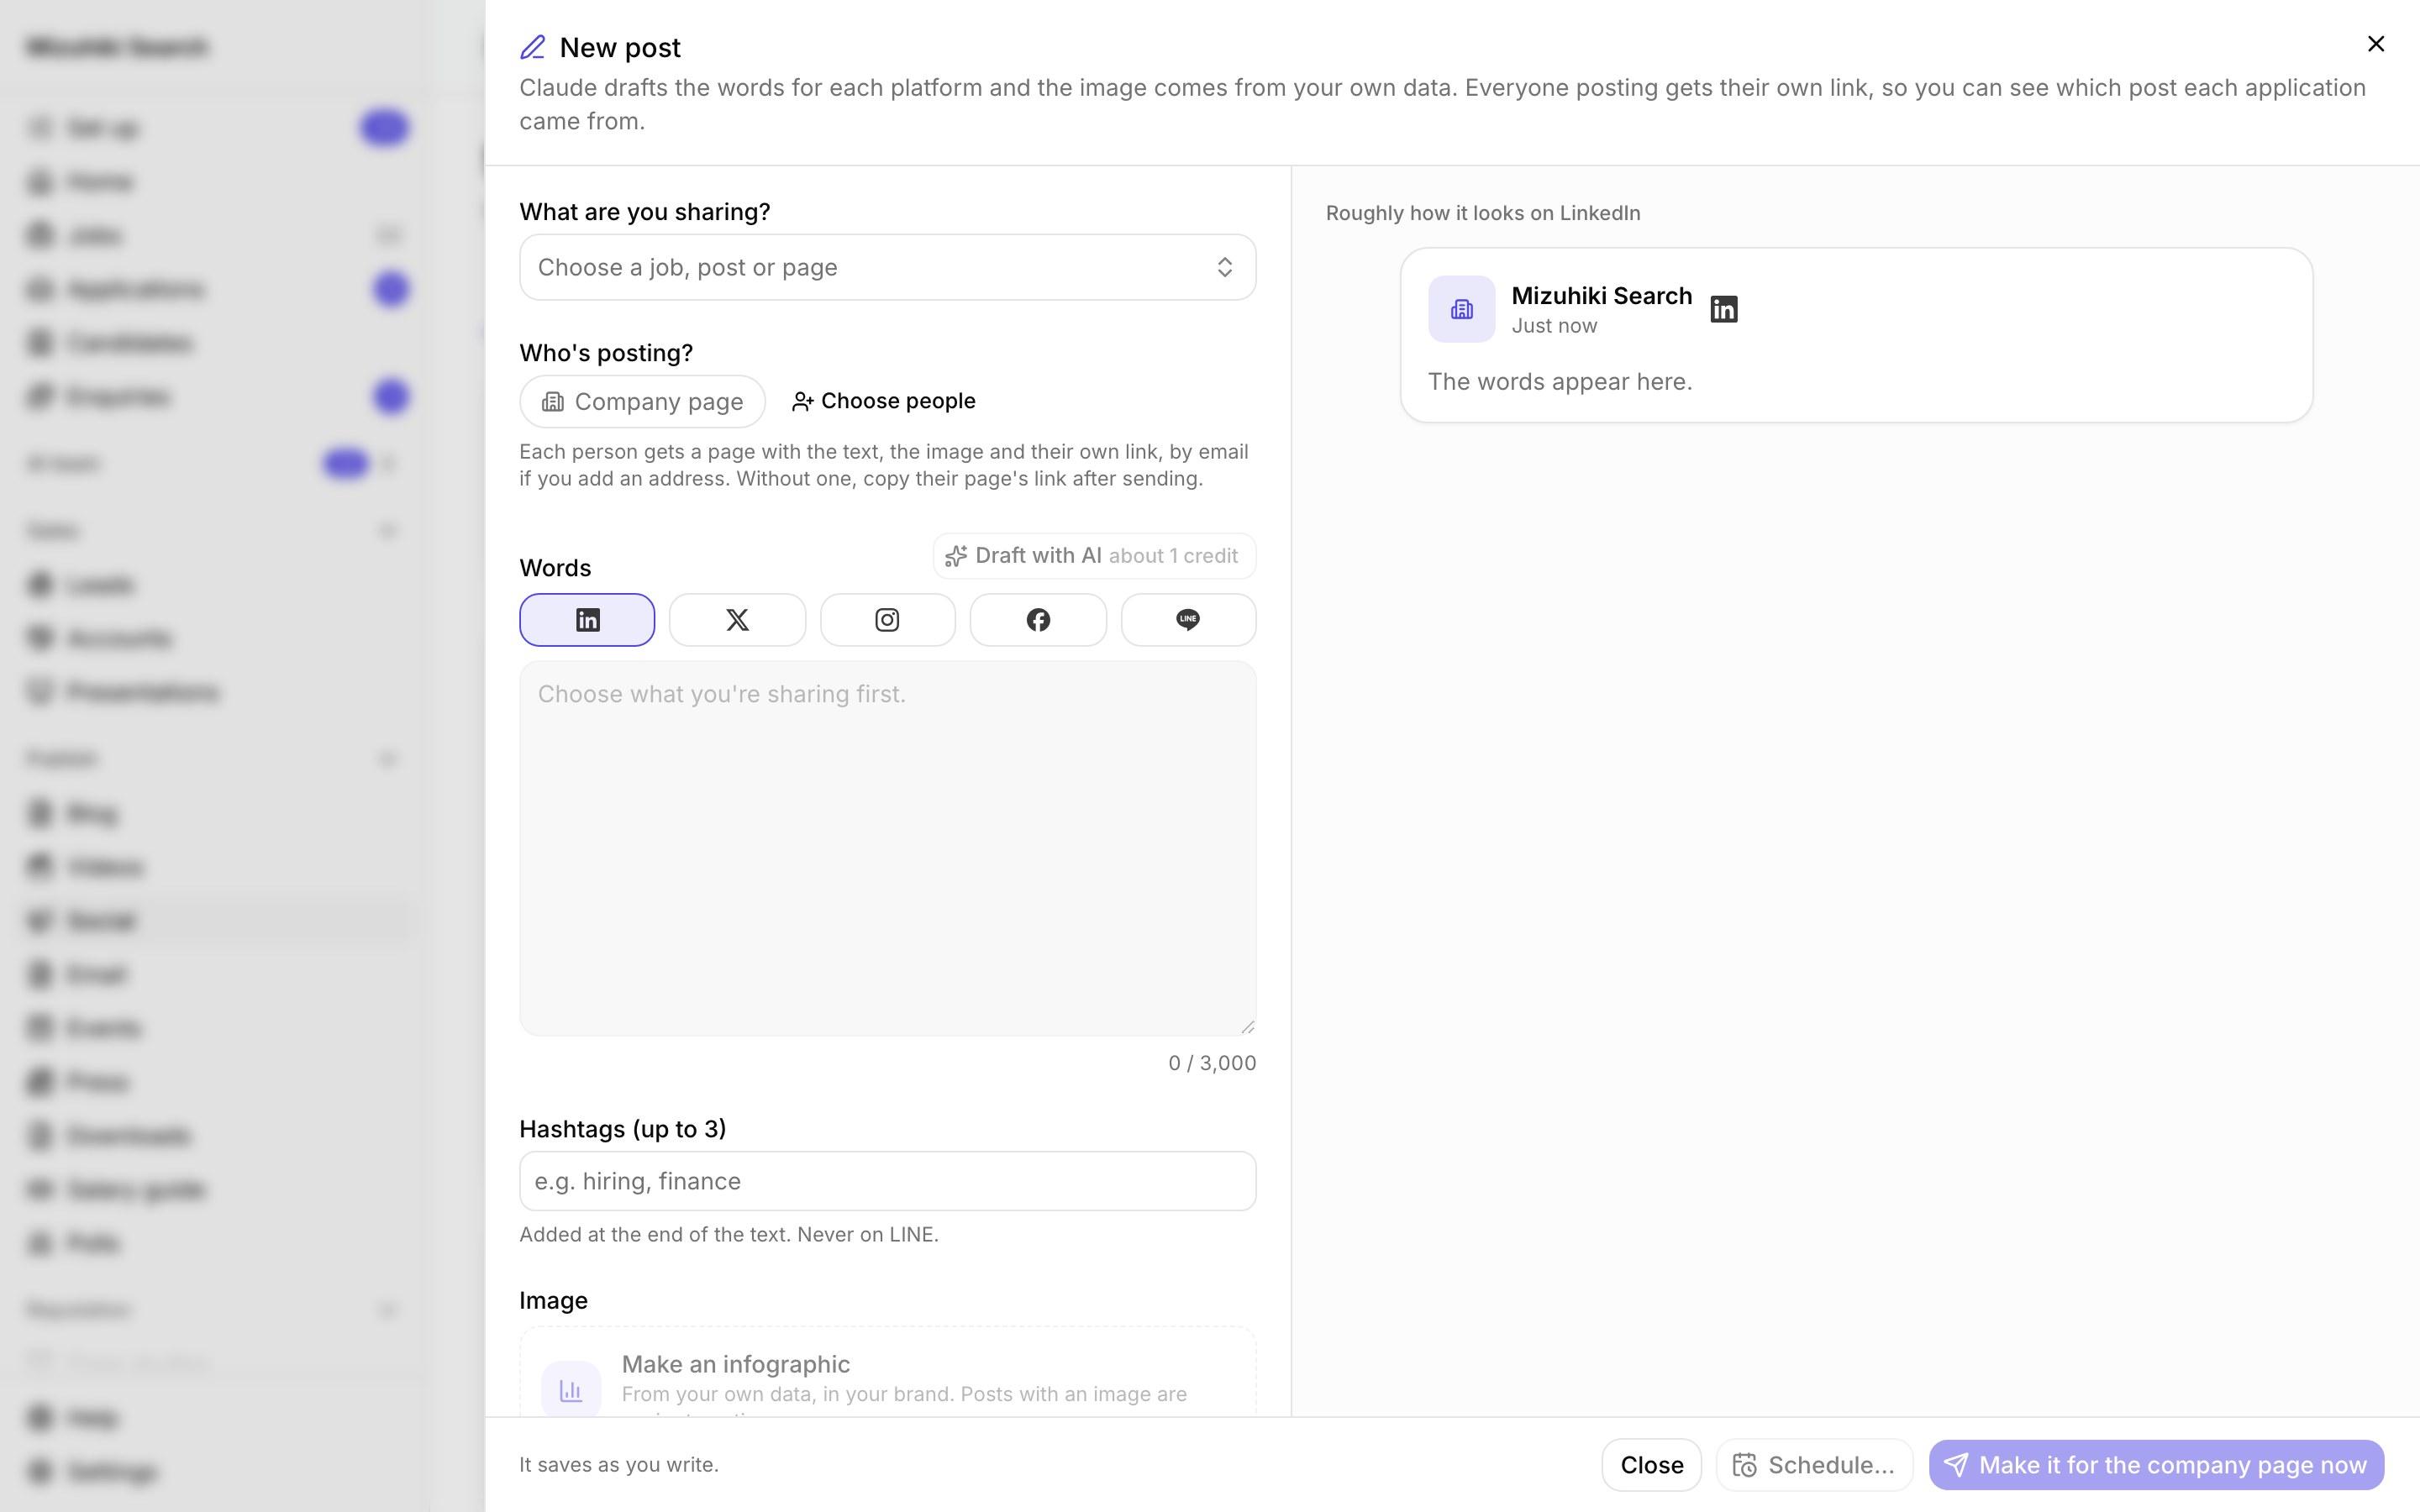
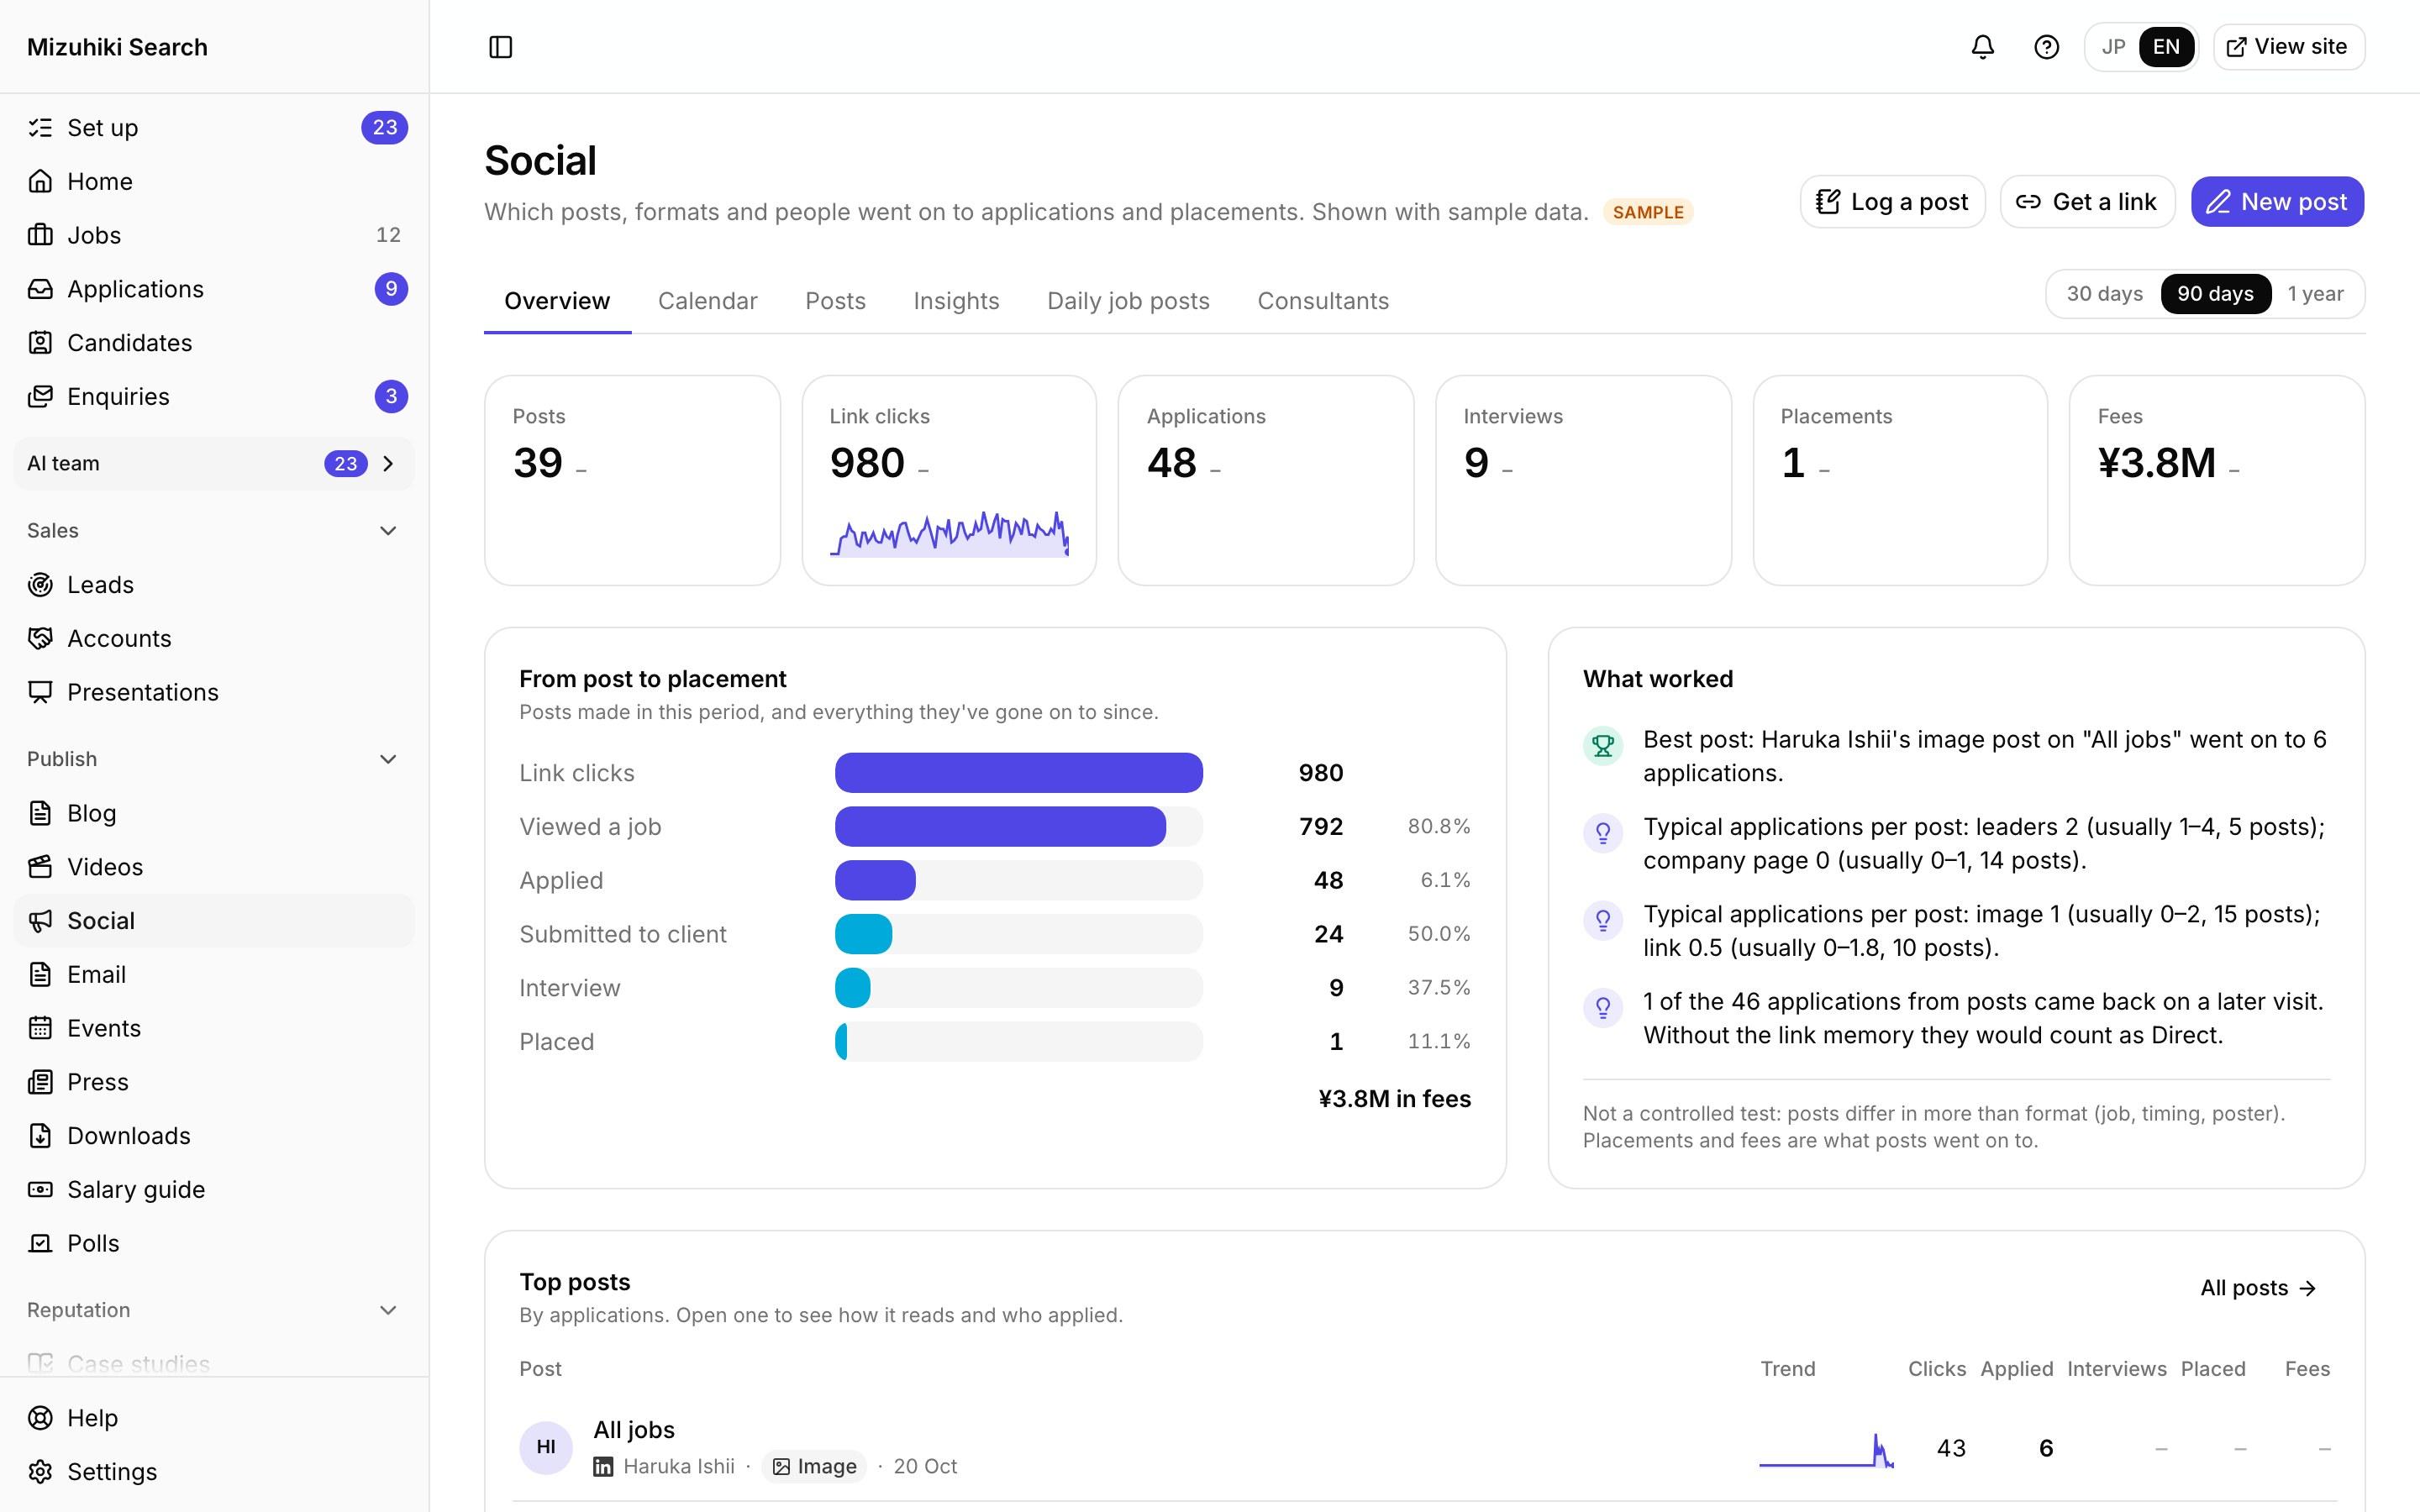
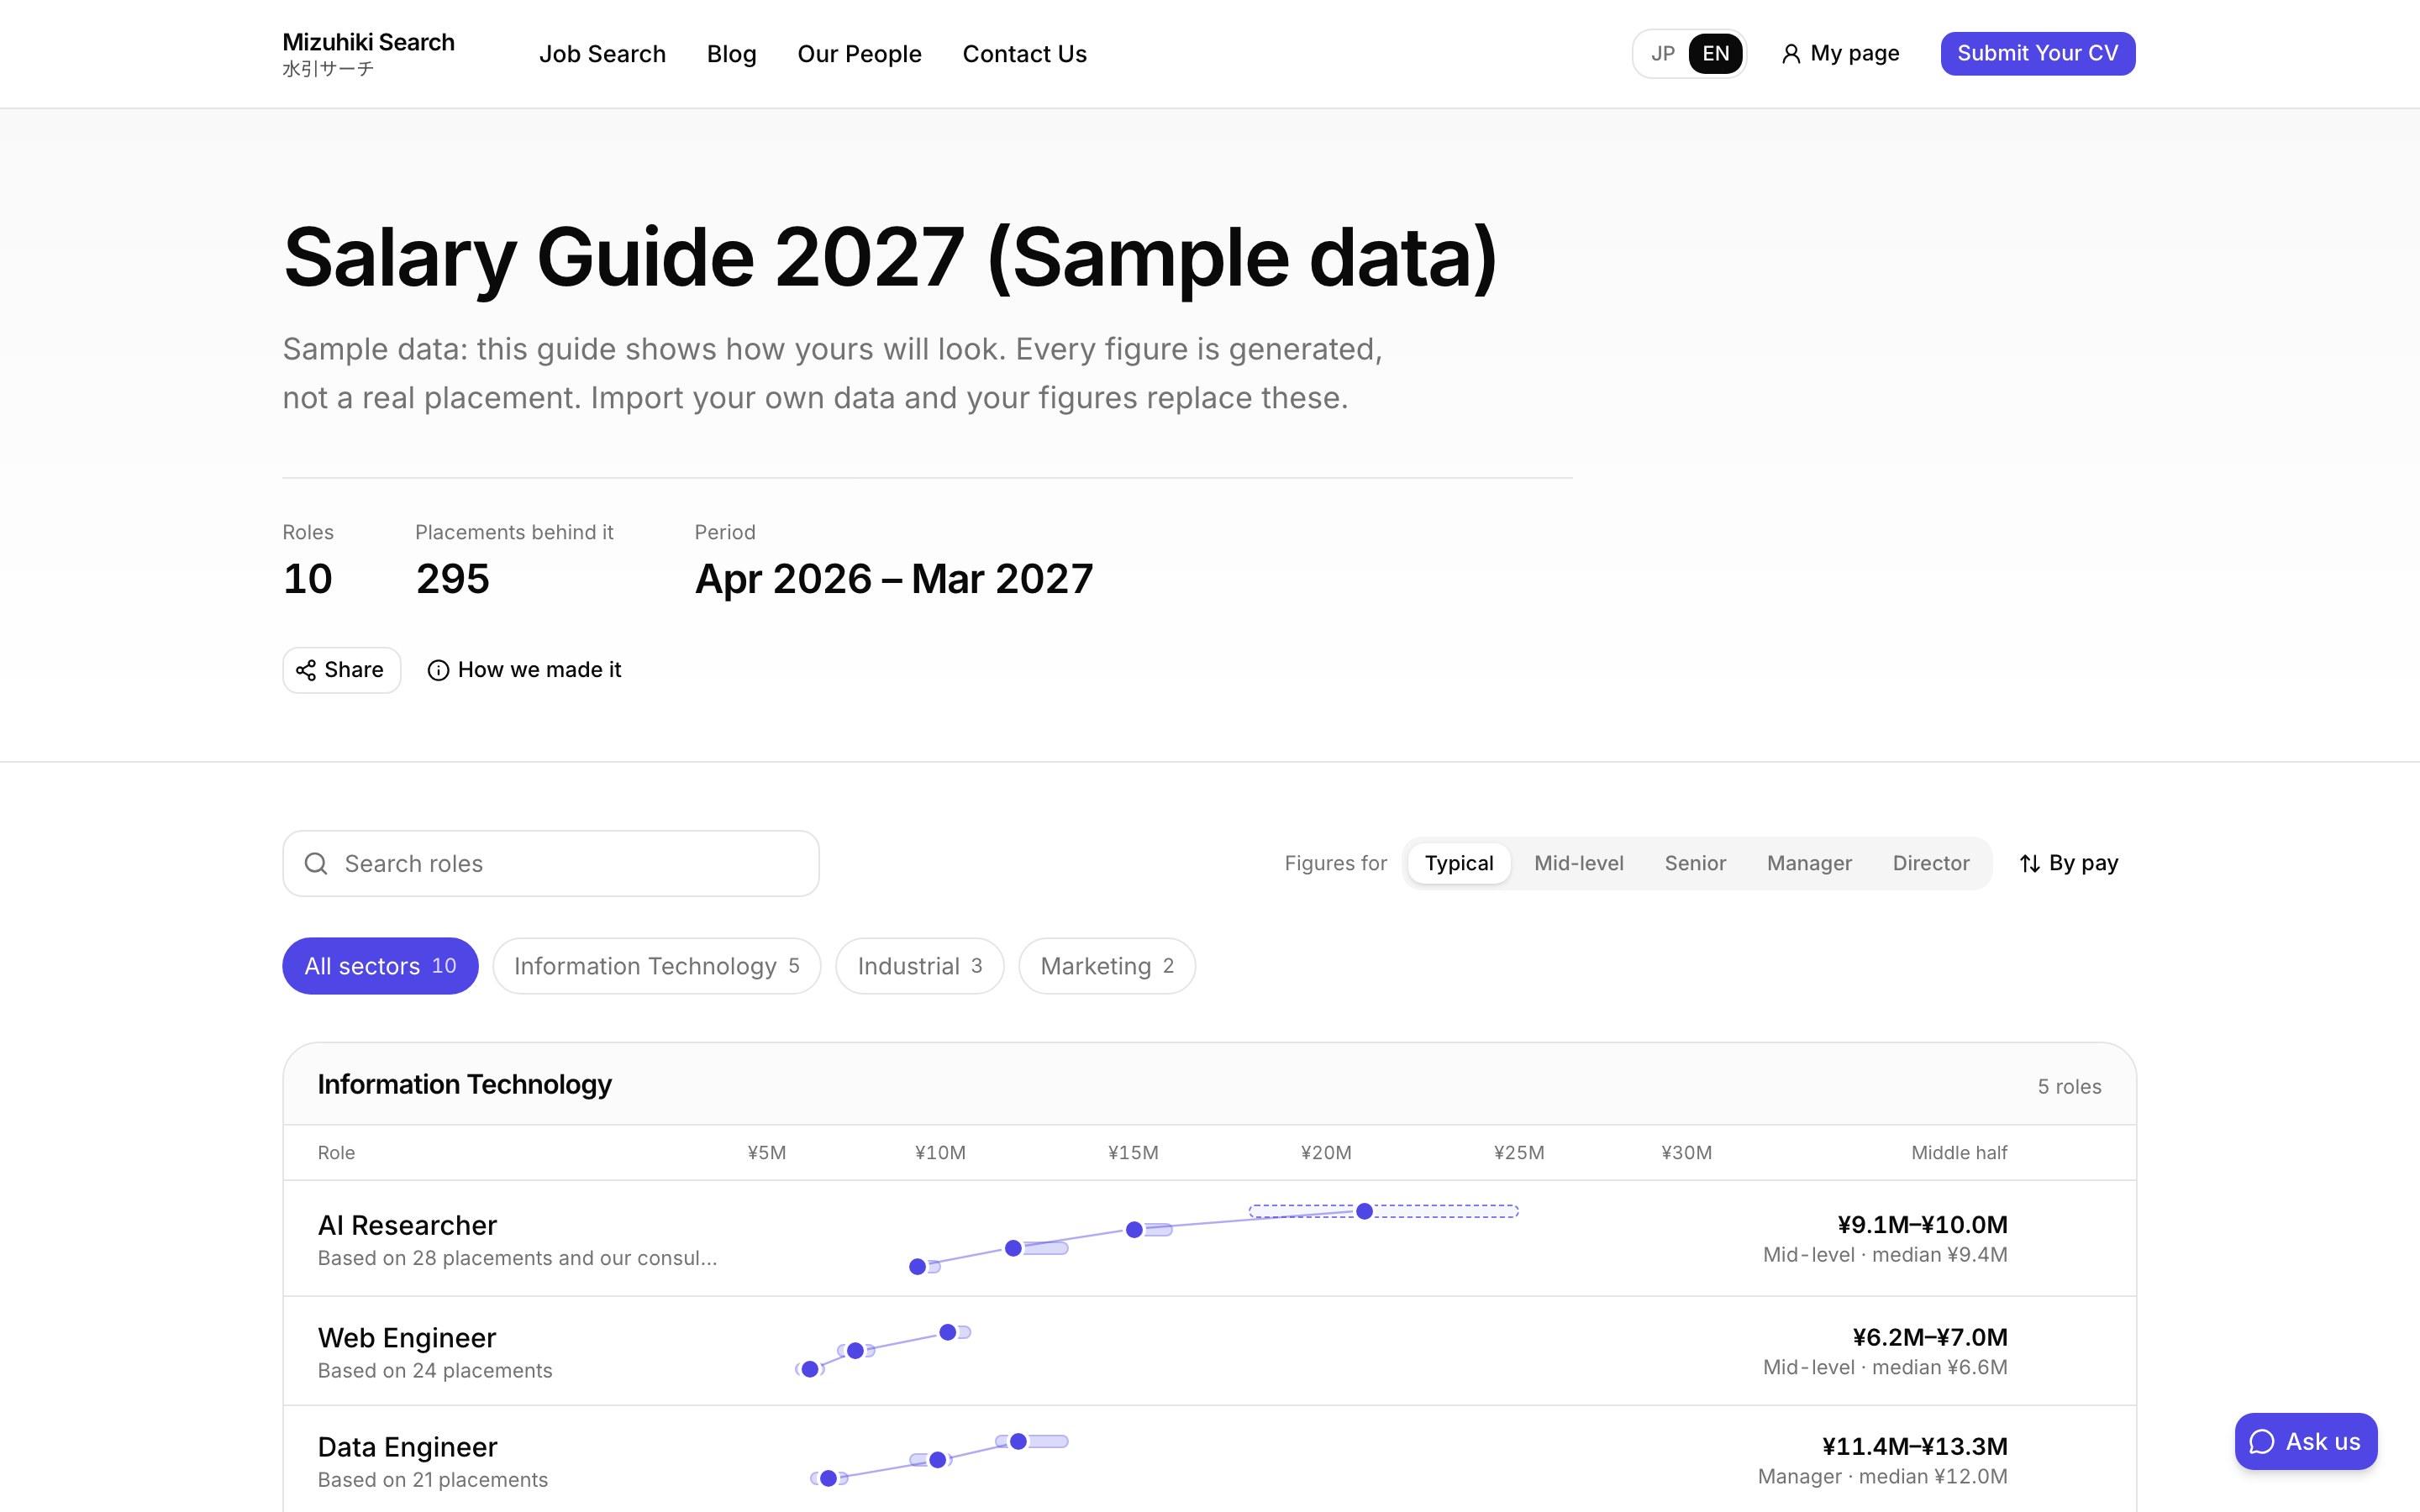
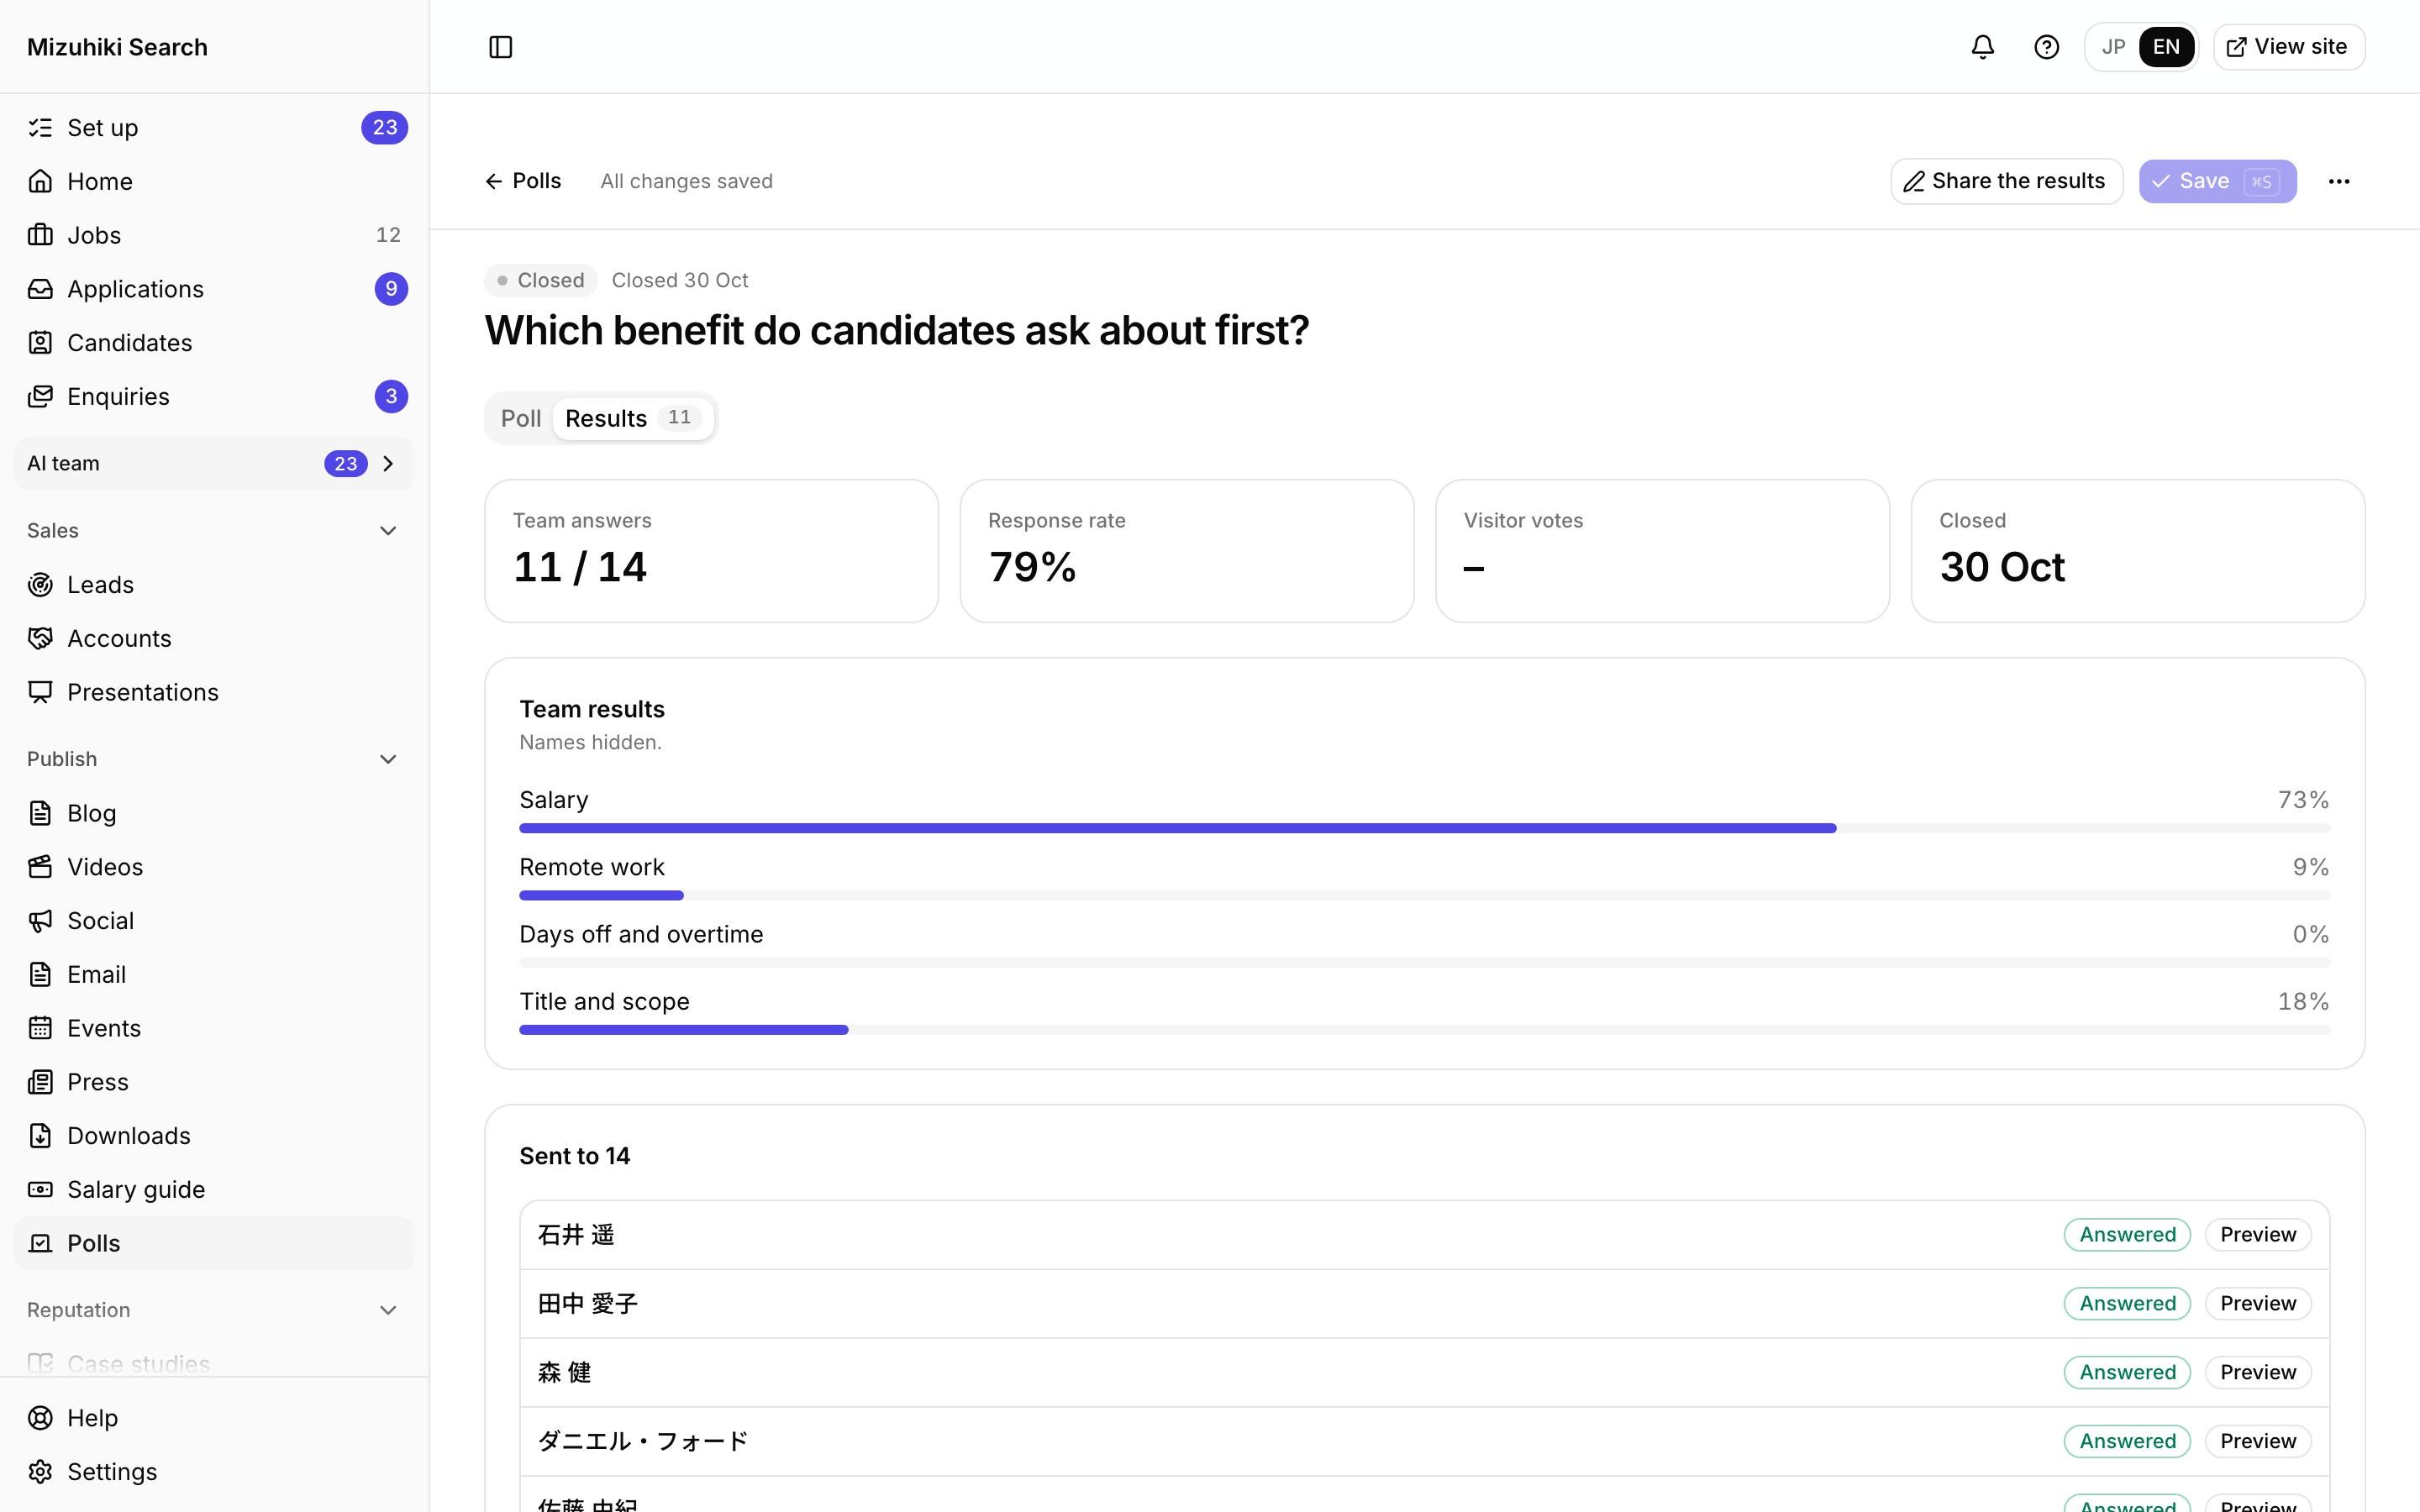
Real screens from Mizuhiki Search, a demo agency. Every name and figure on them is a sample.
How it works
Images that are never made up
01 · Infographics
A chart from your own data
Jobs by sector, a salary guide role, a poll's results or a list of jobs, in an Editorial, Brand or Ink look. A final check catches overflow, contrast and lonely lines.
Admin · Social · New postOpen it live02 · Animated jobs
A job as an eight-second video
Title, salary, location and one appeal point, animated in your brand. Pay and place come straight from the job and can't be typed over.
Admin · Social · Daily job posts Open it live
03 · In posts
Covers and figures for the blog
The same builder makes blog covers and the Infographic block, so a post and its social image agree.
Admin · Blog Open it live
The Details That Matter
Numbers from the data
AI never types a number or works one out. Every figure is drawn from your records.
Small numbers respected
Salary levels need 3 or more data points, and names-hidden polls 3 or more answers.
Every feed's size
4:5 for feeds, square, and 9:16 for Reels and Shorts.
Confidential stays confidential
On a confidential role, the animation never names the client.
See It on Your Own Agency
We'll rebuild your home page and a job page with your real jobs, on a private link, and open the admin for you to try.
Start free trial